Table of Contents
Important
Jersey monitoring support has been released as a beta release in Jersey 2.1 version. As such, the exposed monitoring public APIs and functionality described in this section may change in the future Jersey releases.
Jersey provides functionality for monitoring JAX-RS/Jersey applications. Application monitoring is useful in cases when you need to identify the performance hot-spots in your JAX-RS application, observe execution statistics of particular resources or listen to application or request lifecycle events. Note that this functionality is Jersey-specific extension to JAX-RS API.
Jersey monitoring support is divided into three functional areas:
- Event Listeners
Event listeners allow users to receive and process a predefined set of events that occur during a application lifecycle (such as application initialization, application destroy) as well as request processing lifecycle events (request started, resource method finished, exception thrown, etc.). This feature is always enabled in Jersey server runtime and is leveraged by the other monitoring features.
- Monitoring Statistics
Jersey can be configured to process lifecycle events in order to expose a wide range of runtime monitoring statistics to the end user. The statistics are accessible trough an injectable MonitoringStatistics interface. The statistics provide general information about the application as well as fine-grained execution statistics on particular resources and sub resources and exposed URIs. For performance reasons, this functionality must be explicitly enabled prior using.
- JMX MBeans with statistics
In addition to the injectable
MonitoringStatisticsdata, Jersey is able to expose the statistics as JMX MBeans (for example ApplicationMXBean). Jersey monitoring MXBeans can be accessed programmatically using JMX APIs or browsed via JMX-enabled tool (JConsolefor example). This functionality is, too, by default disabled for performance reasons and must be enabled if needed.
All monitoring related APIs (beta!) can be found in the jersey-server module in
org.glassfish.jersey.server.monitoring package. Monitoring in Jersey is currently supported on
the server side.
Jersey defines two types of event listeners that you can implement and register with your application:
ApplicationEventListener for listening to application events, and
RequestEventListener for listening to events of request processing.
Only the first type, ApplicationEventListener
can be directly registered as an application-wide provider. The RequestEventListener
is designed to be specific to every request and can be only returned from the
ApplicationEventListener as such.
Let's start with an example. The following examples show simple implementations of Jersey event listeners as well as a test JAX-RS resource that will be monitored.
Example 21.1. Application event listener
public class MyApplicationEventListener
            implements ApplicationEventListener {
    private volatile int requestCnt = 0;

    @Override
    public void onEvent(ApplicationEvent event) {
        switch (event.getType()) {
            case INITIALIZATION_FINISHED:
                System.out.println("Application "
                        + event.getResourceConfig().getApplicationName()
                        + " was initialized.");
                break;
            case DESTROY_FINISHED:
                System.out.println("Application "
                    + event.getResourceConfig().getApplicationName() destroyed.");
                break;
        }
    }

    @Override
    public RequestEventListener onRequest(RequestEvent requestEvent) {
        requestCnt++;
        System.out.println("Request " + requestCnt + " started.");
        // return the listener instance that will handle this request.
        return new MyRequestEventListener(requestCnt);
    }
}
Example 21.2. Request event listener
public class MyRequestEventListener implements RequestEventListener {
    private final int requestNumber;
    private final long startTime;

    public MyRequestEventListener(int requestNumber) {
        this.requestNumber = requestNumber;
        startTime = System.currentTimeMillis();
    }

    @Override
    public void onEvent(RequestEvent event) {
        switch (event.getType()) {
            case RESOURCE_METHOD_START:
                System.out.println("Resource method "
                    + event.getUriInfo().getMatchedResourceMethod()
                        .getHttpMethod()
                    + " started for request " + requestNumber);
                break;
            case FINISHED:
                System.out.println("Request " + requestNumber
                    + " finished. Processing time "
                    + (System.currentTimeMillis() - startTime) + " ms.");
                break;
        }
    }
}
Example 21.3. Event listener test resource
@Path("resource")
public class TestResource {
    @GET
    public String getSomething() {
        return "get";
    }

    @POST
    public String postSomething(String entity) {
        return "post";
    }
}
Once the listeners and the monitored resource is defined, it's time to initialize our application. The following
piece of code shows a ResourceConfig that is used to initialize the application (please
note that only ApplicationEventListener is registered as provider).
ResourceConfig resourceConfig =
            new ResourceConfig(TestResource.class, MyApplicationEventListener.class)
            .setApplicationName("my-monitored-application");
Our example application now contains a simple resource TestResource that defines resource methods
for GET and POST and a custom MyApplicationEventListener event listener.
The registered MyApplicationEventListener implements two methods defined by the
ApplicationEventListener interface. A method onEvent() handles
all application lifecycle events. In our case the method handles only 2 application events - initialization
and destroy. Other event types are ignored. All application event types are defined
in ApplicationEvent.Type. The second method onRequest
is invoked by Jersey runtime every time a new request is received. The request event type passed to the method
is always START. If you want to listen to any other request lifecycle events for the new request,
you are expected to return an instance of RequestEventListener that will handle the
request. It is important to understand, that the instance will handle only the request for which it has been returned
from an ApplicationEventListener.onRequest method and not any other requests. In our case the
returned request event listener keeps information about the request number of the current request and a start time of
the request which is later used to print out the request processing times statistics. This demonstrates the principle
of listening to request events: for one request there is a one instance which can be used to hold all the information
about the particular request. In other words, RequestEventListener is designed to be
implicitly request-scoped.
Jersey represents lifecycle events via RequestEvent and
ApplicationEvent types. Instances of these classes contain information
about respective events. The most important information is the event type Type retrievable via
getType() method,
which identifies the type of the event. Events contain also additional information that is dependent on a particular
event type. This information can be retrieved via event getters. Again, some getters return valid information for all
event types, some are specific to a sub-set of event types. For example, in the
RequestEvent, the getExceptionCause() method returns valid
information only when event type is ON_EXCEPTION. On the other hand,
a getContainerRequest() can be used to return current request context for any request event type.
See javadoc of events and event types to get familiar with event types and information valid for each event type.
Our MyRequestEventListener implementation is focused on processing 2 request events. First,
it listens for an event that is triggered before a resource method is executed. Also, it hooks to a "request finished"
event. As mentioned earlier, the request event START is handled only in the
MyApplicationEventListener. The START event type will never be invoked on
RequestEventListener. Therefore the logic for measuring the startTime is in the
constructor which is invoked from MyApplicationEventListener.onRequest(). An attempt to handling
the request START event in a RequestEventListener.onEvent() method would be a
mistake.
Let's deploy the application and use a simple test client code to produce some activity in order to spawn new events:
target.path("resource").request()
        .post(Entity.entity("post", MediaType.TEXT_PLAIN_TYPE));
    target.path("resource").request().get();
In the code above, the target is a WebTarget instance pointing to the application
context root path. Using the Chapter 5, Client API, we invoke GET and POST methods
on the MyResource JAX-RS resource class that we implemented earlier.
When we start the application, run the test client and then stop the application, the console output for the deployed server-side application would contain the following output:
Application my-monitored-application was initialized.
Request 1 started.
Resource method POST started for request 1
Request 1 finished. Processing time 330 ms.
Request 2 started.
Resource method GET started for request 2
Request 2 finished. Processing time 4 ms.
Application my-monitored-application destroyed.
Implement event listeners as thread safe. While individual events will be arriving serially, individual listener invocations may occur from different threads. Thus make sure that your listeners are processing data safely with respect to their Java Memory Model visibility (in the example above the fields
requestNumber,startTimeofMyRequestEventListenerare final and therefore the same value is visible for all threads executing theonEvent()method).Do not block the thread executing the event listeners by performing long-running tasks. Execution of event listeners is a part of the standard application and request processing and as such needs to finish as quickly as possible to avoid negative impact on overall application performance.
Do not try to modify mutable objects returned from
ApplicationEventandRequestEventgetters to avoid experiencing undefined behavior. Events listeners should use the information for read only purposes only. Use different techniques like filters, interceptors or other providers to modify the processing of requests and applications. Even though modification might be possible and might work as desired now, your code is in risk of producing intermittent failures or unexpected behaviour (for example after migrating to new Jersey version).If you do not want to listen to request events, do not return an empty listener in the
onRequest()method. Returnnullinstead. Returning empty listener might have a negative performance impact. Do not rely on JIT optimizing out the empty listener invocation code.If you miss any event type or any detail in the events, let us know via Jersey user mailing list.
Event listeners described in the previous section are all-purpose facility. For example, you may decide to use them to measure various execution statistics of your application. While this might be an easy task for simple statistics like "how much time was spent on execution of each Java method?", nevertheless, if you want to measure statistics based on URIs and individual resources, the implementation might get rather complex soon, especially when considering sub-resources and sub-resource locators. To save you the trouble, Jersey provides feature for collecting events and calculating a pre-defined set of monitoring and execution statistics, including application configuration, exception mappers execution, minimum/maximum/average execution times for individual resource methods as well as entire request processing etc.
Calculating the monitoring statistics has obviously a performance impact, therefore this feature is
disabled by default. To enable the feature, set the following configuration property to true:
jersey.config.server.monitoring.statistics.enabled=true
The property description can be found in ServerProperties.MONITORING_STATISTICS_ENABLED This will calculate the statistics. The easiest way how to get statistics is to let Jersey to inject them. See the following example:
Example 21.4. Injecting MonitoringStatistics
@Path("resource")
public static class StatisticsResource {
    @Inject
    Provider<MonitoringStatistics> monitoringStatisticsProvider;

    @GET
    public String getSomething() {
        final MonitoringStatistics snapshot
            = monitoringStatisticsProvider.get().snapshot();

        final TimeWindowStatistics timeWindowStatistics
            = snapshot.getRequestStatistics()
              .getTimeWindowStatistics().get(0l);

        return "request count: " + timeWindowStatistics.getRequestCount()
            + ", average request processing [ms]: "
            + timeWindowStatistics.getAverageDuration();
    }
}}
MonitoringStatistics are
injected into the resource using an @Inject annotation.
Please note the usage of the Provider for injection (it will be discussed later).
Firstly, the snapshot of statistics is retrieved by the snapshot() method.
The snapshot of statistics is an immutable copy of statistics which does not change over the time.
Additionally, data in a snapshot are consistent. It's recommended to create snapshots before working with
the statistics data and then process the snapshot data.
Working with original non-snapshot data makes sense when data consistency is not important and
performance is of highest concern. While it is currently not the case, the injected non-snapshot data may
be implemented as mutable for performance reasons in a future release of Jersey.
The injected monitoring statistics represent the root of the collected statistics hierarchy. The hierarchy
can be traversed to retrieve any partial statistics data. In the example, we retrieve certain request
TimeWindowStatistics data. In our case, those are the request execution statistics
for a time window defined by long value 0 which means unlimited time window. This means we are retrieving
the global request execution statistics measured since a start of the application.
Finally, request count and average duration from the statistics are used to produce the String response.
When we invoke few GET requests on the StatisticsResource, we get the
following console output:
request count: 1, average request processing [ms]: 260
request count: 2, average request processing [ms]: 135
request count: 3, average request processing [ms]: 93
request count: 4, average request processing [ms]: 73
Let's look closer at MonitoringStatistics interface.
MonitoringStatistics interface defines getters by which other nested
statistics can be retrieved. All statistics are in the same package and ends with
Statistics postfix. Statistics interfaces are the following:
- MonitoringStatistics
main top level statistics
- ResponseStatistics
response statistics (eg. response status codes and their count)
- ResourceStatistics
statistics of execution of resources (resource classes or resource URIs)
- ResourceMethodStatistics
statistics of execution of resource methods
- ExecutionStatistics
statistic of execution of a target (resource, request, resource method)
- TimeWindowStatistics
statistics of execution time in specific interval (eg. executions in last 5 minutes)
Each time-monitored target contains ExecutionStatistics. So, for example
resource method contains execution statistics of its execution. Each
ExecutionStatistics contains multiple
TimeWindowStatistics. Currently, each
ExecutionStatistics contains
TimeWindowStatistics for these time windows:
0: unlimited=> all execution since start of the application
1000: 1s => stats measured in last 1 second
15000: 15s => stats measured in last 15 seconds
60000: 1min => stats measured in last 1 minute
900000: 15min => stats measured in last 15 minutes
3600000: 1hour => stats measured in last hour minutes
All the time window statistics can be retrieved from a Map<Long, TimeWindowStatistics>
map returned from ExecutionStatistics.getTimeWindowStatistics(). Key of the map
is the number of milliseconds of interval (so, for example key 60000 points
to statistics for last one minute).
Note, that snapshot() method was called in the example only on the top level
MonitoringStatistics. This produced a snapshot of the entire
tree of statistics and therefore we do not need to call snapshot()
on TimeWindowStatistics again.
Statistics are injected using the Provider. This is preferred way of
injecting statistics. The reason is simple. Statistics might change over time and contract
of MonitoringStatistics does not make any assumptions about mutability of
monitoring statistics instances (to allow future optimizations and changes in implementation strategy). In
order to get always latest statistics, we recommend injecting a Provider rather than a
direct reference and use it's get() method to retrieve the latest statistics. For example,
in singleton resources the use of the technique is very important otherwise statistics might correspond
to the time when singleton was firstly created and might not update since that time.
Statistics are not calculated for each request or each change. Statistics are calculated only from the collected data in regular intervals for performance reasons (for example once per second). If you want to be notified about new statistics, register an implementation of MonitoringStatisticsListener as one of your custom application providers. Your listener will be called every time the new statistics are calculated and the updated statistics data will be passed to the listener method. This is another way of receiving statistics. See the linked listener API documentation for more information.
Note
Jersey examples contains a Monitoring Web Application Example which demonstrates usage of MBean statistics.
Jersey provides feature to expose monitoring statistics as JMX MXBeans.
In order to enable monitoring statistics MXBeans exposure, the
ServerProperties.MONITORING_STATISTICS_MBEANS_ENABLED must be set to true.
jersey.config.server.monitoring.statistics.mbeans.enabled=true
Note that enabling exposure of monitoring MXBeans causes that also the calculation of
MonitoringStatistics is automatically enabled as the exposed
MXBean statistics are extracted from MonitoringStatistics.
The easiest way is to browse the MXBeans in the JConsole. Open the JConsole
($JAVA_HOME/bin/jconsole). Then connect to the process where JAX-RS application is running
(server on which the application is running). Switch to a MBean tab and in the MBean tree on the left side
find a group org.glassfish.jersey. All deployed Jersey applications are located under this
group. If you don't see such this group, then MBeans are not exposed (check the configuration property and
logs if they not contain any exceptions or errors). The following figure is an example of an output from the
JConsole:
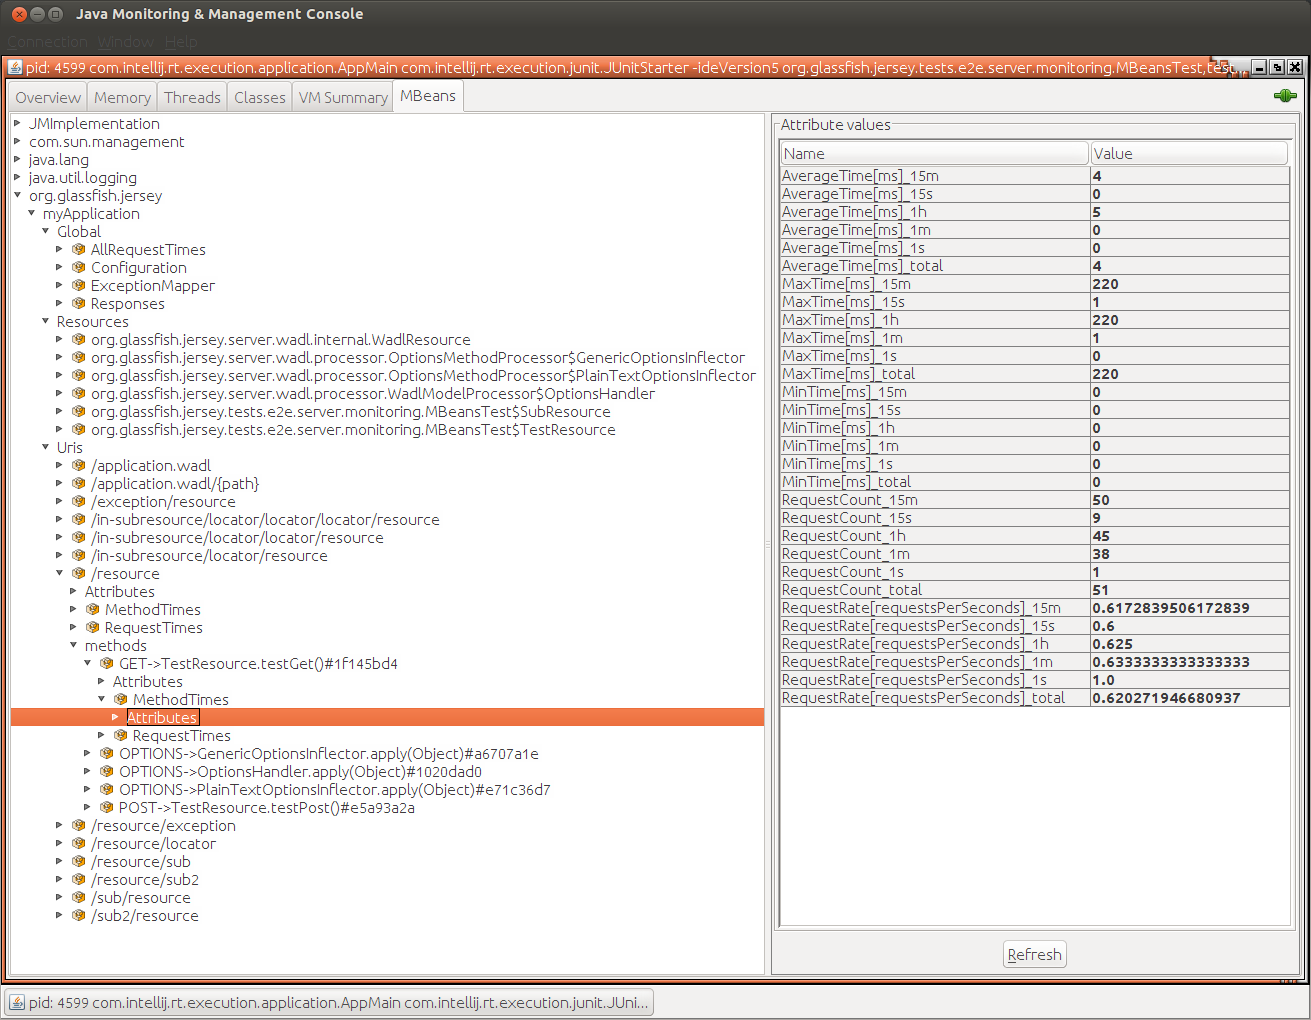 |
Under the root org.glassfish.jersey Jersey MBean group you can find your application.
If the server contains more Jersey application, all will be present under the root Jersey the group. In the
screen-shot, the deployed JAX-RS application is named myApplication (the name can be defined
via ResourceConfig directly or by setting the ServerProperties.APPLICATION_NAME
property).
Each application contains Global, Resource and
Uris sub-groups. The Global group contains all global
statistics like overall requests statistics of the entire application (AllRequestTimes),
configuration of the JAX-RS application (Configuration), statistics about
ExceptionMapper<E extends Throwable> execution (ExceptionMapper) and statistics about
produced responses (Responses).
Resources and Uris groups contains monitoring statistics specific to
individual resources.
Statistics in Resources are bound to the JAX-RS resource Java classes loaded by the
application. Uris contains statistics of resources based on the matched application Uris
(one URI entry represents all methods bound to the particular URI, e.g. /resource/exception).
As Jersey provides programmatic resource builders (described in the chapter
"Programmatic API for Building Resources"), one Java resource class
can be an endpoint for resource methods on many different URIs. And also one URI can be served by method from
many different Java classes. Therefore both views are not to be compared 1:1. Instead they provide
different loggical views on your JAX-RS application. This monitoring feature can also help when designing
the JAX-RS APIs as it provides nice view on available root application URIs.
Both logical views on the resources exposed by application share few common principles. A single resource entry
is always a set of resource methods which are available under the methods sub-group. Statistics
can be found in MBeans MethodTimes and RequestTimes.
MethodTimes contains statistics measured on on resource methods (duration of execution of a
code of the a resource method), whereas RequestTimes contains statistics of an entire request
execution (not only a time of the execution of the resource method but the overall time of the execution of whole
request by Jersey runtime). Another useful information is that statistics directly under resource (not under
the methods sub-group) contains summary of statistics for all resource methods grouped in the
resource entry.
Additional useful details that about statistics
Global->Configuration->Registered(Classes/Instances): registered resource classes and instances by the user (i.e., not added by ModelProcessor during deployment for example).Global->ExceptionMapper->ExceptionMapperCount: map that contains exception mapper classes as keys and number of their execution as values.Global->Responses->ResponseCodesToCountMap: map that contains response codes as keys and their total occurrence in responses as values.Resource groups contain also entries for resources that were added by Jersey at deployment time using
ModelProcessor(for example allOPTIONSmethods,WADL).HEADmethods are not present in the MXBeans view (even HEAD methods are in resources).Execution statistics for different time windows have different update intervals. The shorter the time window, the shorter the update interval. This causes that immediately after the application start, the shorter time windows (such as 15 seconds) may contain higher values than longer ones (e.g. 1 hour time window). The reason is that 1 hour interval will show information that is not up to date and therefore has smaller value. This inconsistency is not so much significant when application is running longer time. Total unlimited time windows contains always up-to-date data. This inconsistency will get fixed in a future Jersey release.
MXBeans can be also accessed using JMX. To do so, you would need to use the interfaces of MXBeans.
These interfaces are even useful when working with MXBeans only trough JConsole as
they contain Javadocs for each MXBean and attribute. Monitoring MBeans are defined by following interfaces:
ApplicationMXBean: contains configuration statistics
ExceptionMapperMXBean: contains statistics of exception mappers
ResourceMethodMXBean: contains statistics of resource method
ResourceMXBean: contains statistics of resource
ResponseMXBean: contains statistics of responses
The list does not contain MXBean for the execution and time window statistics. The reason is that this bean is defined as a DynamicMBean. Attributes of this dynamic MBean contains statistics for all time windows available.
MXBeans do not reference each other but can be retrieved by their ObjectNames which
are designed in the way, that final MBean tree looks nicely organized in JConsole.
Each MXBean is uniquely identified by its ObjectName and properties of
ObjectName are structured hierarchically, so that each MXBean can be identified to which
parent it belong to (e.g. execution statistics dynamic MXBean belongs to resource method MXBean, which
belongs to resource and which belongs to application). Check the ObjectNames of
exposed MXBeans to investigate the structure (for example through JConsole).
To reiterate, exposing Jersey MXBeans and the calculating monitoring statistics may have an performance impact on your application and therefore should be enabled only when needed. Also, please note, that it Jersey monitoring is exposing quite a lot of information about the monitored application which might be viewed as problematic in some cases (e.g. in production server deployments).
Apart from monitoring and collecting application statistics described in Section 21.1, “Monitoring Jersey Applications”, Jersey
can also provide tracing or diagnostic information about server-side processing of individual requests.
This facility may provide vital information when troubleshooting your misbehaving Jersey or JAX-RS application.
When enabled, Jersey tracing facility collects useful information from all parts of JAX-RS server-side request
processing pipeline:
PreMatchRequestFilter, ResourceMatching, RequestFilter,
ReadIntercept, MBR, Invoke,
ResponseFilter, WriteIntercept, MBW, as well as
ExceptionHandling.
The collected tracing information related to a single request is returned to the requesting client in the HTTP headers of a response for the request. The information is also logged on the server side using a dedicated Java Logger instance.
Tracing support is disabled by default. You can enable it either "globally" for all application requests
or selectively per request. The tracing support activation is controlled by setting the
jersey.config.server.tracing.type application configuration property. The property value
is expected to be one of the following:
OFF- tracing support is disabled (default value).ON_DEMAND- tracing support is in a stand-by mode; it is enabled selectively per request, via a specialX-Jersey-Tracing-AcceptHTTP request header.ALL- tracing support is enabled for all request.
The level of detail of the information provided by Jersey tracing facility - the tracing threshold - can be
customized. The tracing threshold can be set at the application level via
jersey.config.server.tracing.threshold application configuration property,
or at a request level, via X-Jersey-Tracing-Threshold HTTP request header. The request level
configuration overrides any application level setting. There are 3 supported levels of detail for Jersey tracing:
SUMMARY- very basic summary information about the main request processing stages.TRACE- detailed information about activities in all the main request processing stages (default threshold value).VERBOSE- most verbose mode that provides extended information similar toTRACElevel, however with details on entity providers (MBR/MBW) that were skipped during the provider selection phase for any reason (lower priority, pattern matching, etc). Additionally, in this mode all received request headers are echoed as part of the tracing information.
As mentioned earlier, all tracing information is also logged using a dedicated Java Logger. The individual
tracing messages are logged immediately as the tracing events occur. The default name of the tracing logger
is prefixed org.glassfish.jersey.tracing. with a default suffix general.
This logger name can be customized per request by including a X-Jersey-Tracing-Logger
HTTP request header as will be shown later.
Whenever the tracing support is active (ON_DEMAND or ALL) you
can customize the tracing behaviour by including one or more of the following request HTTP headers in your
individual requests:
X-Jersey-Tracing-Accept- used to enable the tracing support for the particular request. It is applied only when the application-level tracing support is configured toON_DEMANDmode. The value of the header is not used by the Jersey tracing facility and as such it can be any arbitrary (even empty) string.X-Jersey-Tracing-Threshold- used to override the tracing level of detail. Allowed values are:SUMMARY,TRACE,VERBOSE.X-Jersey-Tracing-Logger- used to override the tracing Java logger name suffix.
At the end of request processing all tracing messages are appended to the HTTP response as individual
headers named X-Jersey-Tracing-nnn where
nnn is index number of message starting at 0.
Each tracing message is in the following format: CATEGORY [TIME] TEXT, e.g.
X-Jersey-Tracing-007: WI [85.95 / 183.69 ms | 46.77 %] WriteTo summary: 4 interceptors
The CATEGORY is used to categorize tracing events according to the following
event types:
START- start of request processing informationPRE-MATCH- pre-matching request filter processingMATCH- matching request URI to a resource methodREQ-FILTER- request filter processingRI- entity reader interceptor processingMBR- message body reader selection and invocationINVOKE- resource method invocationRESP-FILTER- response filter processingWI- write interceptor processingMBW- message body writer selection and invocationMVC- template engine integrationEXCEPTION- exception mappingFINISHED- processing finish summary
The TIME, if present, is a composite value that consists of 3 parts
[ duration / time_from_start | total_req_ratio ]:
duration- the duration of the current trace event [milliseconds]; e.g. duration of filter processingtime_from_start- the end time of the current event with respect to the request processing start time [milliseconds]total_req_ratio- the duration of the current event with respect to the total request processing time [percentage]; this value tells you how significant part of the whole request processing time has been spent in the processing phase described by the current event
There are certain tracing events that do not have any duration. In such case, duration values are not set
(---- literal).
The tracing event TEXT is a free-form detailed text information about the
current diagnostic event.
Tip
For better identification, instances of JAX-RS components are represented by class name,
identity hash code and @Priority value if set, e.g.
[org.glassfish.jersey.tests.integration.tracing.ContainerResponseFilter5001 @494a8227 #5001].
Example of SUMMARY level messages
from tests/integration/tracing-support module:
Example 21.5. Summary level messages
  1 $ curl -i http://localhost:9998/ALL/root/sub-resource-locator/sub-resource-method -H content-type:application/x-jersey-test --data '-=#[LKR]#=-' -H X-Jersey-Tracing-Threshold:SUMMARY -H accept:application/x-jersey-test -X POST
  2
  3 X-Jersey-Tracing-000: START       [ ---- /  ---- ms |  ---- %] baseUri=[http://localhost:9998/ALL/] requestUri=[http://localhost:9998/ALL/root/sub-resource-locator/sub-resource-method] method=[POST] authScheme=[n/a] accept=[application/x-jersey-test] accept-encoding=n/a accept-charset=n/a accept-language=n/a content-type=[application/x-jersey-test] content-length=[11]
  4 X-Jersey-Tracing-001: PRE-MATCH   [ 0.01 /  0.68 ms |  0.01 %] PreMatchRequest summary: 2 filters
  5 X-Jersey-Tracing-002: MATCH       [ 8.44 /  9.15 ms |  4.59 %] RequestMatching summary
  6 X-Jersey-Tracing-003: REQ-FILTER  [ 0.01 /  9.20 ms |  0.00 %] Request summary: 2 filters
  7 X-Jersey-Tracing-004: RI          [86.14 / 95.49 ms | 46.87 %] ReadFrom summary: 3 interceptors
  8 X-Jersey-Tracing-005: INVOKE      [ 0.04 / 95.70 ms |  0.02 %] Resource [org.glassfish.jersey.tests.integration.tracing.SubResource @901a4f3] method=[public org.glassfish.jersey.tests.integration.tracing.Message org.glassfish.jersey.tests.integration.tracing.SubResource.postSub(org.glassfish.jersey.tests.integration.tracing.Message)]
  9 X-Jersey-Tracing-006: RESP-FILTER [ 0.01 / 96.55 ms |  0.00 %] Response summary: 2 filters
 10 X-Jersey-Tracing-007: WI          [85.95 / 183.69 ms | 46.77 %] WriteTo summary: 4 interceptors
 11 X-Jersey-Tracing-008: FINISHED    [ ---- / 183.79 ms |  ---- %] Response status: 200/SUCCESSFUL|OK
Example TRACE level messages of jersey-mvc-jsp integration,
from examples/bookstore-webapp module:
Example 21.6. On demand request, snippet of MVC JSP forwarding
  1 $ curl -i http://localhost:9998/items/3/tracks/0 -H X-Jersey-Tracing-Accept:whatever
  2
  3 ...
  4 X-Jersey-Tracing-033: WI          [ 0.00 / 23.39 ms |  0.02 %] [org.glassfish.jersey.server.mvc.internal.TemplateMethodInterceptor @141bcd49 #4000] BEFORE context.proceed()
  5 X-Jersey-Tracing-034: WI          [ 0.01 / 23.42 ms |  0.02 %] [org.glassfish.jersey.filter.LoggingFilter @2d427def #-2147483648] BEFORE context.proceed()
  6 X-Jersey-Tracing-035: MBW         [ ---- / 23.45 ms |  ---- %] Find MBW for type=[org.glassfish.jersey.server.mvc.internal.ImplicitViewable] genericType=[org.glassfish.jersey.server.mvc.internal.ImplicitViewable] mediaType=[[javax.ws.rs.core.MediaType @7bfbfeae]] annotations=[]
  7 X-Jersey-Tracing-036: MBW         [ ---- / 23.52 ms |  ---- %] [org.glassfish.jersey.server.mvc.internal.ViewableMessageBodyWriter @78b353d4] IS writeable
  8 X-Jersey-Tracing-037: MVC         [ ---- / 24.05 ms |  ---- %] Forwarding view to JSP page [/org/glassfish/jersey/examples/bookstore/webapp/resource/Track/index.jsp], model [org.glassfish.jersey.examples.bookstore.webapp.resource.Track @3937f594]
  9 X-Jersey-Tracing-038: MBW         [ 1.09 / 24.63 ms |  4.39 %] WriteTo by [org.glassfish.jersey.server.mvc.internal.ViewableMessageBodyWriter @78b353d4]
 10 X-Jersey-Tracing-039: WI          [ 0.00 / 24.67 ms |  0.01 %] [org.glassfish.jersey.filter.LoggingFilter @2d427def #-2147483648] AFTER context.proceed()
 11 X-Jersey-Tracing-040: WI          [ 0.00 / 24.70 ms |  0.01 %] [org.glassfish.jersey.server.mvc.internal.TemplateMethodInterceptor @141bcd49 #4000] AFTER context.proceed()
 12 ...