-
Regular sampling
-
Creates a historical record
13 Monitoring Broker Operations
This chapter describes the tools you can use to monitor a broker and how you can get metrics data. The chapter has the following sections:
Reference information on specific metrics is available in Metrics Information Reference
Monitoring Services
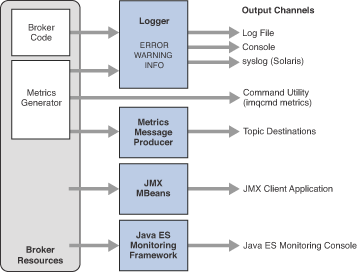
The broker includes components for monitoring and diagnosing application and broker performance. These include the components and services shown in the following figure:
-
Broker code that logs broker events.
-
A metrics generator that provides.
The metrics generator provides information about broker activity, such as message flow in and out of the broker, the number of messages in broker memory and the memory they consume, the number of open connections, and the number of threads being used. The boolean broker propertyimq.metrics.enabledcontrols whether such information is logged and theimq.metrics.intervalproperty specifies how often metrics information is generated. -
A logger component that writes out information to a number of output channels.
-
A comprehensive set of Java Management Extensions (JMX) MBeans that expose broker resources using the JMX API
-
Support for the Java ES Monitoring Framework
-
A metrics message producer that sends JMS messages containing metrics information to topic destinations for consumption by JMS monitoring clients.
Broker properties for configuring the monitoring services are listed under Monitoring Properties.
Figure 13-1 Monitoring Services Support
Introduction to Monitoring Tools
There are five tools (or interfaces) for monitoring Message Queue information, as described briefly below:
-
Log files provide a long-term record of metrics data, but cannot easily be parsed.
-
The Command Utility (
imqcmd metrics) lets you interactively sample information tailored to your needs, but does not provide historical information or allow you to manipulate the data programmatically. -
The Java Management Extensions (JMX) Administration API lets you perform broker resource configuration and monitoring operations programmatically from within a Java application. You can write your own JMX administration application or use the standard Java Monitoring and Management Console (
jconsole). -
The Sun Java Enterprise System Monitoring Framework (JESMF) and Monitoring Console offers a common, Web-based graphical interface shared with other Java ES components, but can monitor only a subset of all Message Queue entities and operations.
-
The Message-based Monitoring API lets you extract metrics information from messages produced by the broker to metrics topic destinations. However, to use it, you must write a Message Queue client application to capture, analyze, and display the metrics data.
The following tabel compares the different tools.
Table 13-1 Benefits and Limitations of Metrics Monitoring Tools
| Metrics Monitoring Tool | Benefits | Limitations |
|---|---|---|
Log files |
|
|
Command Utility ( |
|
|
JMX Administration API |
|
|
Java ES Monitoring Console |
|
|
Message-based Monitoring API |
|
|
In addition to the differences shown in the table, each tool gathers a somewhat different subset of the metrics information generated by the broker. For information on which metrics data is gathered by each monitoring tool, see Metrics Information Reference.
Configuring and Using Broker Logging
The Message Queue Logger takes information generated by broker code, a
debugger, and a metrics generator and writes that information to a
number of output channels: to standard output (the console), to a log
file, and, on Solaris platforms, to the syslog daemon process. You can
specify the type of information gathered by the Logger as well as the
type of information the Logger writes to each of the output channels.
For example, you can specify that you want metrics information written
out to a log file.
This section describes the configuration and use of the Logger for monitoring broker activity. It includes the following topics:
Logger Properties
The imq.log.file.dirpath and imq.log.file.filename broker properties
identify the log file to use and the imq.log.console.stream property
specifies whether console output is directed to stdout or stderr.
The imq.log.level property controls the categories of metric
information that the Logger gathers: ERROR, WARNING, or INFO. Each
level includes those above it, so if you specify, for example, WARNING
as the logging level, error messages will be logged as well.
There is also an imq.destination.logDeadMsgs property that specifies
whether to log entries when dead messages are discarded or moved to the
dead message queue.
The imq.log.console.output and imq.log.file.output properties
control which of the specified categories the Logger writes to the
console and the log file, respectively. In this case, however, the
categories do not include those above them; so if you want, for
instance, both errors and warnings written to the log file and
informational messages to the console, you must explicitly set
imq.log.file.output to ERROR|WARNING and imq.log.console.output to
INFO.
On Solaris platforms another property, imq.log.syslog.output,
specifies the categories of metric information to be written to the
syslog daemon.
In the case of a log file, you can specify the point at which the file
is closed and output is rolled over to a new file. Once the log file
reaches a specified size (imq.log.file.rolloverbytes) or age
(imq.log.file.rolloversecs), it is saved and a new log file created.
See Monitoring Properties for additional broker properties related to logging and subsequent sections for details about how to configure the Logger and how to use it to obtain performance information.
Log Message Format
A logged message consists of a time stamp, a message code, and the
message itself. The volume of information included varies with the
logging level you have set. The broker supports three logging levels:
ERROR, WARNING , and INFO (see Table 13-2). Each
level includes those above it (for example, WARNING includes ERROR).
Table 13-2 Logging Levels
| Logging Level | Description |
|---|---|
|
Serious problems that could cause system failure |
|
Conditions that should be heeded but will not cause system failure |
|
Metrics and other informational messages |
The default logging level is INFO, so messages at all three levels are
logged by default. The following is an example of an INFO message:
[13/Sep/2000:16:13:36 PDT] [B1004]: Starting the broker service
using tcp [25374,100] with min threads 50 and max threads of 500
You can change the time zone used in the time stamp by setting the
broker configuration property imq.log.timezone (see
Table 17-13).
Default Logging Configuration
A broker is automatically configured to save log output to a set of rolling log files. The log files are located in a directory identified by the instance name of the associated broker:
IMQ_VARHOME/instances/instanceName/log|
Note
|
For a broker whose life cycle is controlled by GlassFish Server, the log files are located in a subdirectory of the domain directory for the domain for which the broker was started: |
The log files are simple text files. The system maintains nine backup files named as follows, from earliest to latest:
log.txt
log_1.txt
log_2.txt
…
log_9.txt
By default, the log files are rolled over once a week. You can change this rollover interval, or the location or names of the log files, by setting appropriate configuration properties:
-
To change the directory in which the log files are kept, set the property
imq.log.file.dirpathto the desired path. -
To change the root name of the log files from
logto something else, set theimq.log.file.filenameproperty. -
To change the frequency with which the log files are rolled over, set the property
imq.log.file.rolloversecs.
See Table 17-13 for further information on these properties.
Changing the Logging Configuration
Log-related properties are described in Table 17-13.
To Change the Logger Configuration for a Broker
-
Set the logging level.
-
Set the output channel (file, console, or both) for one or more logging categories.
-
If you log output to a file, configure the rollover criteria for the file.
You complete these steps by setting Logger properties. You can do this in one of two ways:-
Change or add Logger properties in the
config.propertiesfile for a broker before you start the broker. -
Specify Logger command line options in the
imqbrokerdcommand that starts the broker. You can also use the broker option-Dto change Logger properties (or any broker property).
Options passed on the command line override properties specified in the broker instance configuration files. The followingimqbrokerdoptions- affect logging
-
-metricsinterval-
Logging interval for broker metrics, in seconds
-loglevellevel-
Logging level (
ERROR,WARNING,INFO, orNONE) -silent-
Silent mode (no logging to console)
-tty-
Log all messages to console
The following sections describe how you can change the default configuration in order to do the following:
-
Change the output channel (the destination of log messages)
-
Change rollover criteria
-
Changing the Output Channel
By default, error and warning messages are displayed on the terminal as
well as being logged to a log file. (On Solaris, error messages are also
written to the system’s syslog daemon.)
You can change the output channel for log messages in the following ways:
-
To have all log categories (for a given level) output displayed on the screen, use the
-ttyoption to theimqbrokerdcommand. -
To prevent log output from being displayed on the screen, use the
-silentoption to theimqbrokerdcommand. -
Use the
imq.log.file.outputproperty to specify which categories of logging information should be written to the log file. For example,
imq.log.file.output=ERROR
-
Use the
imq.log.console.outputproperty to specify which categories of logging information should be written to the console. For example,
imq.log.console.output=INFO
-
On Solaris, use the
imq.log.syslog.outputproperty to specify which categories of logging information should be written to Solarissyslog. For example,
imq.log.syslog.output=NONE
|
Note
|
Before changing Logger output channels, you must make sure that logging
is set at a level that supports the information you are mapping to the
output channel. For example, if you set the logging level to |
Changing Log File Rollover Criteria
There are two criteria for rolling over log files: time and size. The default is to use a time criteria and roll over files every seven days.
-
To change the time interval, you need to change the property
imq.log.file.rolloversecs. For example, the following property definition changes the time interval to ten days:
imq.log.file.rolloversecs=864000
-
To change the rollover criteria to depend on file size, you need to set the
imq.log.file.rolloverbytesproperty. For example, the following definition directs the broker to rollover files after they reach a limit of 500,000 bytes
imq.log.file.rolloverbytes=500000
If you set both the time-related and the size-related rollover properties, the first limit reached will trigger the rollover. As noted before, the broker maintains up to nine rollover files.
You can set or change the log file rollover properties when a broker is
running. To set these properties, use the imqcmd update bkr command.
Sending Metrics Data to Log Files
This section describes the procedure for using broker log files to report metrics information. For general information on configuring the Logger, see Configuring and Using Broker Logging.
To Use Log Files to Report Metrics Information
-
Configure the broker’s metrics generation capability:
-
Confirm
imq.metrics.enabled=true
Generation of metrics for logging is turned on by default. -
Set the metrics generation interval to a convenient number of seconds.
imq.metrics.interval=`interval +
This value can be set in the `config.properties
file or using the-metricsinterval command line option when starting up the broker. -
Confirm that the Logger gathers metrics information:
imq.log.level=INFO
This is the default value. This value can be set in the
config.properties file or using the -loglevel level command line
option when starting up the broker.
3. Confirm that the Logger is set to write metrics information to the
log file:
imq.log.file.output=INFOThis is the default value. It can be set in the config.properties
file.
4. Start up the broker.
The following shows sample broker metrics output to the log file:
[21/Jul/2004:11:21:18 PDT]
Connections: 0    JVM Heap: 8323072 bytes (7226576 free) Threads: 0 (14-1010)
      In: 0 msgs (0bytes) 0 pkts (0 bytes)
     Out: 0 msgs (0bytes) 0 pkts (0 bytes)
 Rate In: 0 msgs/sec (0 bytes/sec) 0 pkts/sec (0 bytes/sec)
Rate Out: 0 msgs/sec (0 bytes/sec) 0 pkts/sec (0 bytes/sec)
For reference information about metrics data, see Metrics Information Reference.
Logging Dead Messages
You can monitor physical destinations by enabling dead message logging for a broker. You can log dead messages whether or not you are using a dead message queue.
If you enable dead message logging, the broker logs the following types of events:
-
A physical destination exceeded its maximum size.
-
The broker removed a message from a physical destination, for a reason such as the following:
-
The destination size limit has been reached.
-
The message time to live expired.
-
The message is too large.
-
An error occurred when the broker attempted to process the message.
-
If a dead message queue is in use, logging also includes the following types of events:
-
The broker moved a message to the dead message queue.
-
The broker removed a message from the dead message queue and discarded it.
The following is an example of the log format for dead messages:
[29/Mar/2006:15:35:39 PST] [B1147]: Message 8-129.145.180.87(e7:6b:dd:5d:98:aa)-
35251-1143675279400 from destination Q:q0 has been placed on the DMQ because
[B0053]: Message on destination Q:q0 Expired: expiration time 1143675279402,
arrival time 1143675279401, JMSTimestamp 1143675279400
Dead message logging is disabled by default. To enable it, set the
broker attribute imq.destination.logDeadMsgs.
Using the Command Utility to Display Metrics Interactively
A Message Queue broker can report metrics of the following types:
-
Java Virtual Machine (JVM) metrics. Information about the JVM heap size.
-
Brokerwide metrics. Information about messages stored in a broker, message flows into and out of a broker, and memory use. Messages are tracked in terms of numbers of messages and numbers of bytes.
-
Connection Service metrics. Information about connections and connection thread resources, and information about message flows for a particular connection service.
-
Destination metrics. Information about message flows into and out of a particular physical destination, information about a physical destination’s consumers, and information about memory and disk space usage.
The imqcmd command can obtain metrics information for the broker as a
whole, for individual connection services, and for individual physical
destinations. To obtain metrics data, you generally use the metrics
subcommand of imqcmd. Metrics data is written at an interval you
specify, or the number of times you specify, to the console screen.
You can also use the query subcommand to view similar data that also
includes configuration information. See imqcmd query for
more information.
imqcmd metrics
The syntax and options of imqcmd metrics are shown in
Table 13-3 and Table 13-4, respectively.
Table 13-3 imqcmd metrics Subcommand Syntax
| Subcommand Syntax | Metrics Data Provided |
|---|---|
|
Displays broker metrics for the default broker or a broker at the specified host and port. |
|
Displays metrics for the specified service on the default broker or on a broker at the specified host and port. |
|
Displays metrics information for the physical destination of the specified type and name. |
Table 13-4 imqcmd metrics Subcommand Options
| Subcommand Options | Description |
|---|---|
|
Specifies the hostname and port of the broker for which metrics data is
reported. The default is Literal IP addresses as host names: You can use a literal IPv4 or IPv6 address as a host name. If you use a literal IPv6 address, its format must conform to RFC2732, Format for Literal IPv6 Addresses in URL’s. |
|
Specifies the interval (in seconds) at which to display the metrics. The default is 5 seconds. |
|
Specifies the type of metric to display:
|
|
Specifies the number of samples displayed in the output. The default is an unlimited number (infinite). |
|
Specifies the name of the physical destination (if any) for which metrics data is reported. There is no default. |
|
Specifies the connection service (if any) for which metrics data is reported. There is no default. |
|
Specifies the type (queue or topic) of the physical destination (if any) for which metrics data is reported. There is no default. |
To Use the metrics Subcommand
-
Start the broker for which metrics information is desired.
See Starting Brokers. -
Issue the appropriate
imqcmd metricssubcommand and options as shown in Table 13-3 and Table 13-4.
Metrics Outputs: imqcmd metrics
This section contains examples of output for the imqcmd metrics
subcommand. The examples show brokerwide, connection service, and
physical destination metrics.
Brokerwide Metrics
To get the rate of message and packet flow into and out of the broker at
10 second intervals, use the metrics bkr subcommand:
imqcmd metrics bkr -m rts -int 10 -u adminThis command produces output similar to the following (see data descriptions in Table 21-2):
--------------------------------------------------------
 Msgs/sec   Msg Bytes/sec   Pkts/sec    Pkt Bytes/sec
 In   Out     In      Out     In   Out     In      Out
--------------------------------------------------------
 0     0      27      56      0     0      38      66
 10    0     7365     56      10    10    7457    1132
 0     0      27      56      0     0      38      73
 0     10     27     7402     10    20    1400    8459
 0     0      27      56      0     0      38      73
Connection Service Metrics
To get cumulative totals for messages and packets handled by the jms
connection service, use the metrics svc subcommand:
imqcmd metrics svc -n jms -m ttl -u adminThis command produces output similar to the following (see data descriptions in Table 21-3):
-------------------------------------------------
  Msgs      Msg Bytes      Pkts      Pkt Bytes
In   Out    In     Out   In   Out    In     Out
-------------------------------------------------
164  100  120704  73600  282  383  135967  102127
657  100  483552  73600  775  876  498815  149948
Physical Destination Metrics
To get metrics information about a physical destination, use the
metrics dst subcommand:
imqcmd metrics dst -t q -n XQueue -m ttl -u adminThis command produces output similar to the following (see data descriptions in Table 21-4):
-----------------------------------------------------------------------------
  Msgs      Msg Bytes         Msg Count         Total Msg Bytes (k)     Largest
In   Out    In     Out    Current  Peak  Avg  Current  Peak     Avg    Msg (k)
-----------------------------------------------------------------------------
200  200  147200  147200     0     200    0      0      143      71        0
300  200  220800  147200    100    200   10     71      143      64        0
300  300  220800  220800     0     200    0      0      143      59        0
To get information about a physical destination’s consumers, use the
following metrics dst subcommand:
imqcmd metrics dst -t q -n SimpleQueue -m con -u adminThis command produces output similar to the following (see data descriptions in Table 21-4):
------------------------------------------------------------------
  Active Consumers         Backup Consumers         Msg Count
Current  Peak  Avg      Current  Peak    Avg    Current  Peak  Avg
------------------------------------------------------------------
   1       1      0        0       0      0       944    1000  525
imqcmd query
The syntax and options of imqcmd query are shown in Table
13-5 along with a description of the metrics data provided by the
command.
Table 13-5 imqcmd query Subcommand Syntax
| Subcommand Syntax | Metrics Data Provided |
|---|---|
|
Information on the current number of messages and message bytes stored in broker memory and persistent store (see Viewing Broker Information). |
|
Information on the current number of allocated threads and number of connections for a specified connection service (see Viewing Connection Service Information). |
|
Information on the current number of producers, active and backup consumers, and messages and message bytes stored in memory and persistent store for a specified destination (see Viewing Physical Destination Information). |
|
Note
|
Because of the limited metrics data provided by |
Using the JMX Administration API
The broker implements a comprehensive set of Java Management Extensions (JMX) MBeans that represent the broker’s manageable resources. Using the JMX API, you can access these MBeans to perform broker configuration and monitoring operations programmatically from within a Java application.
In this way, the MBeans provide a Java application access to data values representing static or dynamic properties of a broker, connection, destination, or other resource. The application can also receive notifications of state changes or other significant events affecting the resource.
JMX-based administration provides dynamic, fine grained, programmatic access to the broker. You can use this kind of administration in a number of ways.
-
You can include JMX code in your JMS client application to monitor application performance and, based on the results, to reconfigure the Message Queue resources you use to improve performance.
-
You can write JMX client applications that monitor the broker to identify use patterns and performance problems, and you can use the JMX API to reconfigure the broker to optimize performance.
-
You can write a JMX client application to automate regular maintenance tasks.
-
You can write a JMX client application that constitutes your own version of the Command utility (
imqcmd), and you can use it instead ofimqcmd. -
You can use the standard Java Monitoring and Management Console (
jconsole) that can provide access to the broker’s MBeans.
For information on JMX infrastructure and configuring the broker’s JMX support, see JMX Support. To manage a Message Queue broker using the JMX architecture, see the Open Message Queue Developer’s Guide for JMX Clients.
Using the Java ES Monitoring Console
Message Queue supports the Sun Java System Monitoring Framework (JESMF), which allows Java Enterprise System (Java ES) components to be monitored using a common graphical interface, the Sun Java System Monitoring Console. Administrators can use the Monitoring Console to view performance statistics, create rules for automatic monitoring, and acknowledge alarms. If you are running Message Queue along with other Java ES components, you may find it more convenient to use a single interface to manage all of them.
The Java ES Monitoring Framework defines a common data model, the Common Monitoring Model (CMM), to be used by all Java ES component products. This model enables a centralized and uniform view of all Java ES components. Message Queue exposes the following objects through the Common Monitoring Model:
-
The installed product
-
The broker instance name
-
The broker Port Mapper
-
Each connection service
-
Each physical destination
-
The persistent data store
-
The user repository
Each of these objects is mapped to a CMM object whose attributes can be monitored using the Java ES Monitoring Console. The reference tables in JES Monitoring Framework Reference identify those attributes that are available for JESMF monitoring. For detailed information about the mapping of Message Queue objects to CMM objects, see the Sun Java Enterprise System Monitoring Guide.
To enable JESMF monitoring, you must do the following:
-
Enable and configure the Monitoring Framework for all of your monitored components, as described in the Sun Java Enterprise System Monitoring Guide.
-
Install the Monitoring Console on a separate host, start the master agent, and then start the Web server, as described in the Sun Java Enterprise System Monitoring Guide.
Using the Java ES Monitoring Framework will not affect broker performance, because all the work of gathering metrics is done by the Monitoring Framework, which pulls data from the broker’s existing data monitoring infrastructure.
For information on metric information provided by the Java ES Monitoring Framework, see JES Monitoring Framework Reference.
Using the Message-Based Monitoring API
Message Queue provides a Metrics Message Producer, which receives information from the Metrics Generator at regular intervals and writes the information into metrics messages,. The Metrics Message Producer then sends these messages to one of a number of metric topic destinations, depending on the type of metric information contained in the messages.
You can access this metrics information by writing a client application that subscribes to the metrics topic destinations, consumes the messages in these destinations, and processes the metrics information contained in the messages. This allows you to create custom monitoring tools to support messaging applications. For details of the metric quantities reported in each type of metrics message, see "Using the Metrics Monitoring API" in Open Message Queue Developer’s Guide for Java Clients.
There are five metrics topic destinations, whose names are shown in Table 13-6, along with the type of metrics messages delivered to each destination.
Table 13-6 Metrics Topic Destinations
| Topic Name | Description |
|---|---|
|
Broker metrics |
|
Java Virtual Machine metrics |
|
List of destinations and their types |
`mq.metrics.destination.queue.`queueName |
Destination metrics for queue queueName |
`mq.metrics.destination.topic.`topicName |
Destination metrics for topic topicName |
The broker properties imq.metrics.topic.enabled and
imq.metrics.topic.interval control, respectively, whether messages are
sent to metric topic destinations and how often. The
imq.metrics.topic.timetolive and imq.metrics.topic.persist
properties specify the lifetime of such messages and whether they are
persistent.
Besides the information contained in the body of a metrics message, the header of each message includes properties that provide the following additional information:
-
The message type
-
The address (host name and port number) of the broker that sent the message
-
The time the metric sample was taken
These properties are useful to client applications that process metrics messages of different types or from different brokers.
Setting Up Message-Based Monitoring
This section describes the procedure for using the message-based monitoring capability to gather metrics information. The procedure includes both client development and administration tasks.
To Set Up Message-based Monitoring
-
Write a metrics monitoring client.
See the Open Message Queue Developer’s Guide for Java Clients for instructions on programming clients that subscribe to metrics topic destinations, consume metrics messages, and extract the metrics data from these messages. -
Configure the broker’s Metrics Message Producer by setting broker property values in the
config.propertiesfile: -
Enable metrics message production.
Setimq.metrics.topic.enabled=true
The default value istrue. -
Set the interval (in seconds) at which metrics messages are generated.
Set `imq.metrics.topic.interval=`interval .
The default is 60 seconds. -
Specify whether you want metrics messages to be persistent (that is, whether they will survive a broker failure).
Setimq.metrics.topic.persist.
The default isfalse. -
Specify how long you want metrics messages to remain in their respective destinations before being deleted.
Setimq.metrics.topic.timetolive.
The default value is 300 seconds. -
Set any access control you desire on metrics topic destinations.
See the discussion in Security and Access Considerations below. -
Start up your metrics monitoring client.
When consumers subscribe to a metrics topic, the metrics topic destination will automatically be created. Once a metrics topic has been created, the broker’s metrics message producer will begin sending metrics messages to the metrics topic.
Security and Access Considerations
There are two reasons to restrict access to metrics topic destinations:
-
Metrics data might include sensitive information about a broker and its resources.
-
Excessive numbers of subscriptions to metrics topic destinations might increase broker overhead and negatively affect performance.
Because of these considerations, it is advisable to restrict access to metrics topic destinations.
Monitoring clients are subject to the same authentication and authorization control as any other client. Only users maintained in the Message Queue user repository are allowed to connect to the broker.
You can provide additional protections by restricting access to specific metrics topic destinations through an access control file, as described in User Authorization.
For example, the following entries in an accesscontrol.properties file
will deny access to the mq.metrics.broker metrics topic to everyone
except user1 and user 2.
topic.mq.metrics.broker.consume.deny.user=*
topic.mq.metrics.broker.consume.allow.user=user1,user2
The following entries will only allow users user3 to monitor topic t1.
topic.mq.metrics.destination.topic.t1.consume.deny.user=*
topic.mq.metrics.destination.topic.t1.consume.allow.user=user3
Depending on the sensitivity of metrics data, you can also connect your metrics monitoring client to a broker using an encrypted connection. For information on using encrypted connections, see Message Encryption.
Metrics Outputs: Metrics Messages
The metrics data outputs you get using the message-based monitoring API is a function of the metrics monitoring client you write. You are limited only by the data provided by the metrics generator in the broker. For a complete list of this data, see Metrics Information Reference.